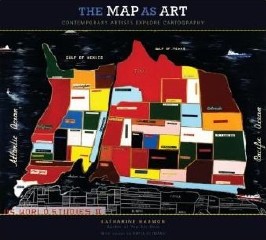

Somewhere in American history, minority groups became linked to liberalism, setting the foundation of Clinton’s America.

Cities are known for minorities and cultural diversity. The “island” forms an individual entity and harbors a different group of people in comparison to the rest of the state. These highly populated urban environments, such as New York City, are essentially isolated from the rest of the state, forming- in correlation to the map-islands. Yet, New York City only covers 0.006% of New York state’s total square mileage. cities, The Big Apple represents the majority of the state’s population, economic activity, and the identification of the state as a whole. When people think of think of the words “New York,” they immediately think of a skyscraper-lined landscape with mass herds of occupants roaming the streets. While the state is often represented by the city, the city is certainly not represented by the state. When looking at the “Clinton’s America” map, the identified cities- Seattle, San Francisco, Los Angeles, Chicago, New York, Boston, Washington, Atlanta, etc.- prove this conjecture to be accurate. So what can we determine from numbers alone? Clinton’s voters have had to come from exceedingly densely populated areas, or particularly cities. With some basic calculations, that comes out to 58 people per square mile whereas Trump’s land would host 1 person for every 2 square miles. To reflect these numbers, the seemingly small islands of Hillary would harbor 54% of the nation’s population at 174 million Americans (Jacobs, 2017). Despite the numbers, Hillary only won 15% or 3,000,000 square miles of the United States’ land mass, leaving Trump with a perplexing remainder of 85% at 350,000,000 square miles. With solely the numbers in mind, one might think that the visual of the election map would show a relatively even split a truly “divided” nation would be both numerically divided and geographically divided, right? According to the map of “Clinton’s America” this was not the case. Not only was the result itself unexpected- according to most polls- but the directional divergence had only occurred four other times in history, three of the four occurring before the 20th century. The difference in direction of the electoral college and the popular vote was confounding to the media all over the nation. Certainly, with Trump at 62,979,879 and Clinton at 65,844,954 totaling to just over 128.8 million votes, the battle between Hillary Clinton and Donald Trump made its mark in American history (Krieg, 2016). If you are a breathing human-being in the United States, or perhaps even elsewhere, you did not go an hour without either hearing or seeing a comment, tweet, picture, video– you name it– regarding the election results on November 9th, 2016.


 0 kommentar(er)
